
rust tooling in 2026
In 2026, the Rust development experience is significantly more polished than it was even a few years ago. The tooling around Rust has matured considerably, moving beyond the 'early adopter' phase to something genuinely robust. This isn't about one single magic bullet, but a collection of tools working well together. The core strengths remain its excellent package management, the reliable build system, and comprehensive testing capabilities.
While Rust previously required more manual configuration, many aspects are now streamlined. This makes it easier for newcomers to get started, and for experienced developers to focus on writing code rather than battling the build process. The ecosystem is now rich enough that you can find tools for almost any task, from basic code formatting to advanced performance profiling.
The current ecosystem centers on Cargo, but specialized linters and performance profilers are now standard for any production service. The infrastructure is finally stable enough for large-scale systems without the constant churn of the early 2020s.

cargo for builds and dependencies
Cargo is the heart of most Rust projects. It’s more than just a package manager; it's a build system, a test runner, and a publication tool all rolled into one. At its most basic, Cargo handles dependency resolution, downloading and building the crates (Rust packages) your project relies on. This is a huge improvement over manually managing dependencies, a common pain point in languages like C++.
Building a project with Cargo is as simple as running `cargo build`. Testing is equally straightforward with `cargo test`. And when you’re ready to share your work, `cargo publish` handles the process of uploading your crate to crates.io, the official Rust package registry. Cargo simplifies a lot of the low-level details, letting you concentrate on writing code.
For larger projects, Cargo workspaces are invaluable. Workspaces allow you to manage multiple crates within a single project, sharing common dependencies and build configurations. Cargo profiles let you customize the build process for different environments – for example, optimizing for release builds or enabling debugging symbols for development. You can define different profiles in your `Cargo.toml` file, specifying optimization levels, link-time optimization, and other build settings.
rust-analyzer and the ide
Rust Analyzer is a Language Server Protocol (LSP) implementation for Rust, and it’s become absolutely essential for a smooth development experience. It provides a rich set of features directly within your editor, like code completion, diagnostics (error highlighting), go-to-definition, find all references, and powerful refactoring tools.
It integrates seamlessly with popular editors like VS Code (probably the most common choice), Vim, and Emacs. Installation is usually straightforward – often just a matter of installing a plugin or extension for your editor. Once set up, Rust Analyzer works in the background, providing real-time feedback as you type.
Configuration options are available to customize Rust Analyzer’s behavior, allowing you to tailor it to your specific preferences. For example, you can adjust the level of diagnostics, control code formatting, and enable or disable certain features. It's a key component for productivity, saving you time and reducing errors.
- The tool provides real-time diagnostics and code completion as you type. It also handles navigation tasks like jumping to definitions or finding all references across a workspace. For larger changes, the built-in refactoring tools can rename symbols or extract logic into new functions without breaking the build.
- Diagnostics: Highlights errors and warnings in real-time.
- Go to Definition: Quickly jump to the definition of a variable or function.
- Find All References: Locate all uses of a particular identifier.
- Refactoring: Rename variables, extract functions, and more.
clippy and rustfmt for code quality
Clippy catches common mistakes that the compiler ignores. It flags unidiomatic code and potential logic errors, like unnecessary clones or inefficient iterator chains. Using it alongside Rustfmt ensures the codebase stays readable without manual style reviews.
Rustfmt, on the other hand, is an automatic code formatter. It takes your code and formats it to a consistent style, according to a predefined set of rules. This eliminates debates about formatting preferences and ensures that everyone on the team is working with code that looks the same.
Integrating Clippy and Rustfmt into your Continuous Integration/Continuous Delivery (CI/CD) pipeline is highly recommended. This ensures that all code changes are automatically checked for errors and formatted correctly before being merged into the main codebase. This can prevent bugs and improve the overall maintainability of your project.
debugging with lldb and gdb
Rust relies on LLDB and GDB for debugging. These tools let you step through execution, set breakpoints, and inspect the stack. While the command line interface is the default, most developers use the wrappers provided by their IDE to visualize variable states during a pause.
Delve is primarily a command-line debugger, though some GUI frontends exist. You can launch Delve from the command line and then use commands to control the debugging process. Setting breakpoints is done by specifying the line number or function name where you want the execution to pause.
Debugging multithreaded Rust applications can be more challenging, but Delve provides tools for inspecting multiple threads and understanding their interactions. For simpler debugging tasks, sometimes adding `println!` statements to your code can be a quick and effective way to understand what's happening. However, for complex issues, Delve is essential.
profiling and performance
Rust is known for its performance, but even the most efficient code can have bottlenecks. Profiling tools help you identify these bottlenecks and optimize your code for speed. On Linux, `perf` is a powerful profiling tool that can provide detailed insights into your application’s performance.
On macOS, Instruments is a similar tool that provides a graphical interface for analyzing performance data. Both tools can help you identify CPU-intensive functions, memory allocations, and other performance issues. Flamegraphs are a particularly useful way to visualize performance data, showing you which functions are consuming the most CPU time.
Cargo-flame is a crate that simplifies the process of generating flamegraphs from Rust applications. It integrates with Cargo and provides a convenient way to collect and visualize performance data. Profiling is a key step in optimizing Rust applications and ensuring they meet your performance requirements.
Level Up Your Rust Setup: Top Gear for Developers in 2026

Stunning 4K UHD resolution for crisp visuals · 27-inch IPS Black technology for superior contrast and color · Extensive connectivity with USB-C hub and multiple ports
Experience unparalleled clarity and vibrant colors on this expansive 4K monitor, perfect for detailed code review and debugging.

Comfortable and quiet Perfect Stroke keys · Logi Bolt technology for secure and reliable wireless connection · Backlit keys with smart illumination
Type with precision and comfort for hours on end with this ergonomic keyboard, featuring quiet keys that won't disturb your focus.
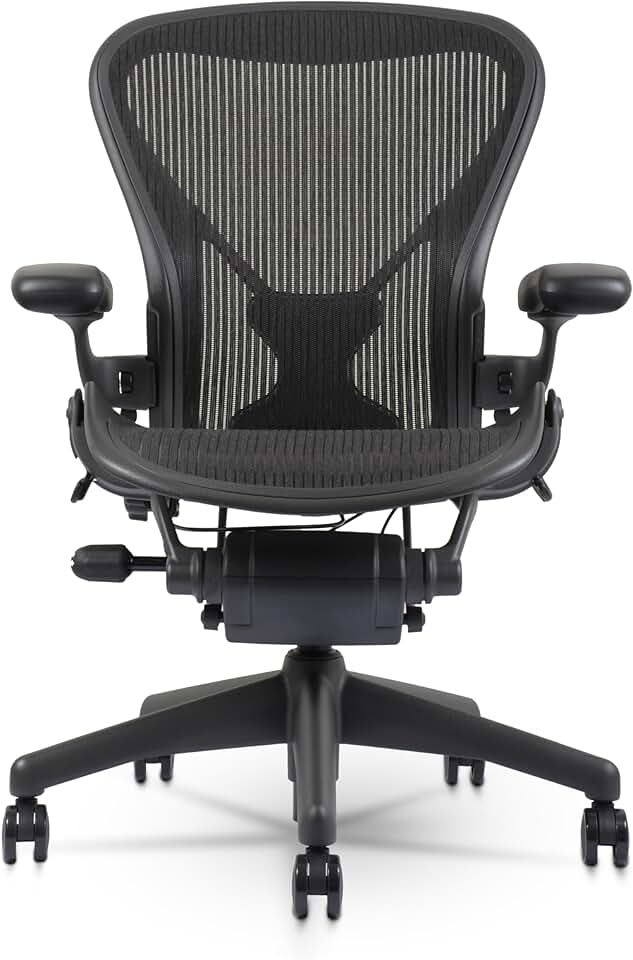
Ergonomic design for optimal posture support · Adjustable PostureFit SL for lumbar support · Breathable Pellicle suspension material
Invest in your long-term comfort and health with the iconic Aeron chair, designed to support you through marathon coding sessions.

Industry-leading noise cancellation · Exceptional sound quality with precise voice pickup · Up to 30 hours of battery life
Immerse yourself in your code without distractions thanks to world-class noise cancellation and crystal-clear audio.

Compact 75% layout with essential keys · Hot-swappable switches for customization · Versatile wired and wireless connectivity
Enjoy a satisfying typing experience with this versatile mechanical keyboard, offering a great balance of features and portability for any setup.
As an Amazon Associate I earn from qualifying purchases. Prices may vary.
testing frameworks
Rust has a built-in testing framework that makes it easy to write unit tests, integration tests, and documentation tests. Unit tests verify the behavior of individual functions or modules, while integration tests verify the interaction between different parts of your application. Documentation tests verify that the examples in your documentation compile and run correctly.
For more advanced testing, consider using `quickcheck`, a library for property-based testing. Property-based testing allows you to define properties that your code should satisfy, and then `quickcheck` automatically generates test cases to verify those properties. This can help you uncover edge cases and bugs that you might miss with traditional unit tests.
Writing thorough tests is essential for building reliable Rust applications. Tools for code coverage analysis can help you measure how much of your code is covered by tests, identifying areas that need more testing. A high level of test coverage gives you confidence that your code is working as expected.


No comments yet. Be the first to share your thoughts!